EzyInsights is proud to announce something we’ve been working on for a long time behind the scenes.
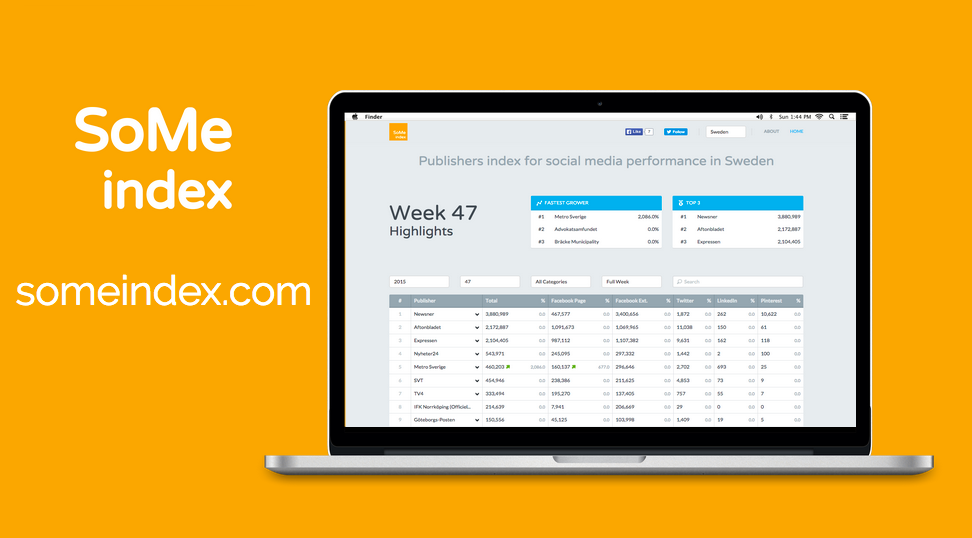
SoMe Index is a website which contains all publisher engagement data from social media, ordered and filtered to give an impartial and realistic view of how news & content publishers are performing.
Our first territory for SoMe Index is Sweden and the website is live now – please check it out at someindex.com.
How & what do we measure?
All visible engagement across the main social platforms. Likes, Comments, Shares on the publisher’s Facebook post, as well as all activity happening around a story unrelated to the publisher’s Facebook post (they may not even have made a Facebook post!). We look at 4 platforms, but the biggest player here is of course Facebook, the mainstream platform. Facebook drives more traffic to news sites than anyone else, even Google.
Who is this data useful for?
Well for a start publishers can use it to give a quick and clear view of the media landscape. How are they doing relative to all the other market players. Those within the advertising industry can also use it to keep track of which sites are producing content that people are really engaging with.
But what has engagement on social media got to do with anything?
One thing we noticed quite early on at EzyInsights was that when you look at a large enough data set, you will see a distinct correlation between engagement and click traffic. On a per post basis you will not see this same correlation – some posts naturally attract more engagement than clicks and vice versa. We have talked in the past in more detail about this subject in this post.
This means it is possible therefore to make some reasonably accurate predictions on traffic based on our collected data. Currently this is not part of the standard SoMe Index site, but we are looking at ways in which we might integrate estimated traffic and even reach into the service. The upside of this method of measuring is that it sidesteps the one main factor plaguing other methods of traffic measurement: bots.
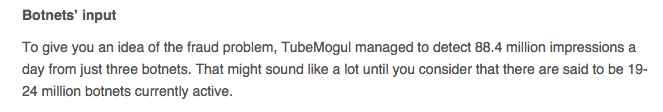
There are many articles charting the prolific rise of bots driving fake traffic data, this one by Bloomberg is pretty interesting. Another article from exchangewire suggests that TubeMogul detected almost 90million impressions in a single day from 3 botnets. There are estimated to be over 20 million botnets currently active.
By relying instead on verified social engagement data, SoMe Index drastically minimises the chances that this engagement is fake. Of course bots and fake profiles do appear across the major social platforms, but to a much much lesser degree than the anonymised data from simple impressions.
What this adds up to is an alternative, fairer way of comparing publishers and the impact of the content they produce with real people. It’s also an interesting insight into actual behaviour. When you dig down deeper into the data you can see trends in what people are more likely to interact with, be that subjects, celebrities, articles on cute baby animals, certain types of news and more.
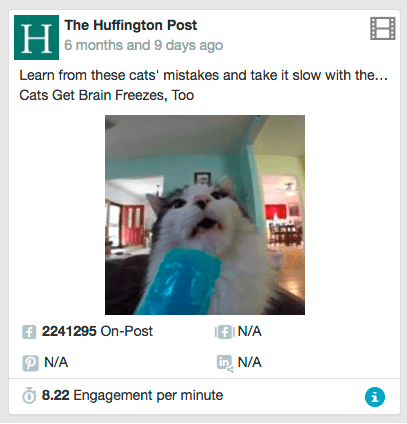
Our sources indicate that cats are still one of the most popular subjects on the internet.
We hope to expand SoMe Index to other European countries fairly soon, get in touch if you think your country should be next!