 Measuring data in digital publishing is well established. Everyone does it, it’s expected, but there’s a huge problem, not everyone is measuring the same thing. Traffic and referrals being the closest linked to actual revenue, tend to be measured in an accurate way across publishers (although even then…). But this information is exclusive to each publisher. So how can anyone, including advertisers, have an idea of which sites have the most readers?
The most obvious is from sites like Sweden’s Kia Index or Finland’s TNS Metrics. They list publishers ranked by estimated engagement. Most people understand they aren’t necessarily accurate, but they’re ‘good enough’. Should you trust them? I believe not – you should not trust any data by default unless you can verify the source. If something is an estimate based on a survey, you should know exactly how many people the survey is based on and whether there is enough of a demographic range to ensure it isn’t skewing results. These things are hard to do. Being skeptical of all data should be the default position of every single person working within the publishing and media (and any) industry. Don’t accept what you see just because it’s there.
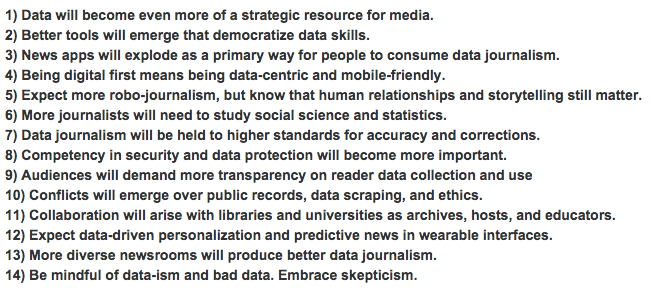
Alexander Howard’s report The Art and and Science of Data-Driven Journalism has been described as “the benchmark study for all other data journalism research.” It contains in its summary, a list of 14 predictions and recommendations. The last one is especially relevant, not just within journalism, but when measuring anything!
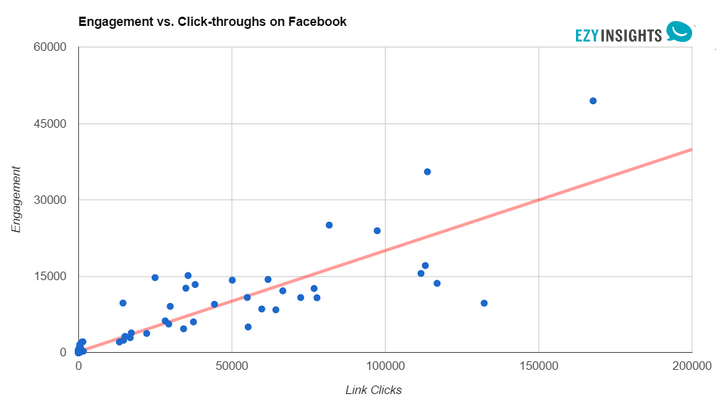
I have a fantastic example of how looking at the same data in two different ways can give an entirely different conclusion. We know that measuring engagement on social media gives a close correlation with clicks/referrals – provided you’re looking at a large enough set of data. Measuring engagement data is simple, right? Well, almost.
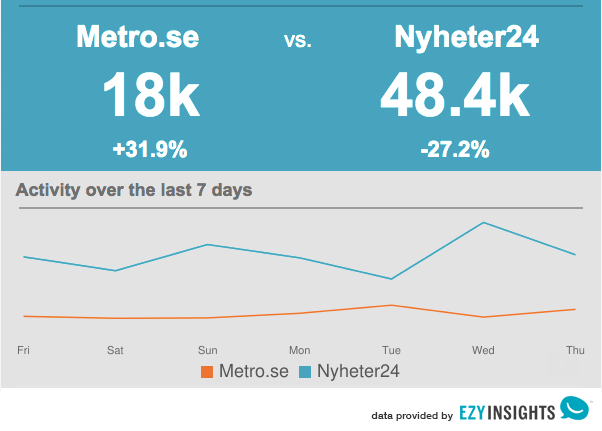
Firstly, you have to understand what engagement data means. What we are typically looking at is visible interactions occurring on posts made on social platforms that are measurable by third parties. Likes, comments, shares, retweets pins etc. As Facebook drives by far the most engagement and traffic out of the social platforms, here’s a Facebook only example with Metro Sweden vs Nyheter24.
This is a common way to measure engagement and thus performance and success on social platforms. And you can see from the image that Nyheter24 is massively outperforming Metro on Facebook (and usually does) right? But, that’s only half the picture! Firstly – measuring this way doesn’t include all activity on Facebook that takes place away from the publisher’s original post. So let’s throw that “off post” engagement in as well. Crucially as well, all the engagement measured in the first example includes pictures and videos posted to Facebook. While these are valuable and contribute to the overall reach of a publisher’s Facebook page, it doesn’t make for a particularly accurate comparison, because we don’t separate how many of the likes, comments and shares were generated on posts that can’t drive any direct traffic. How much of the cake is just icing?
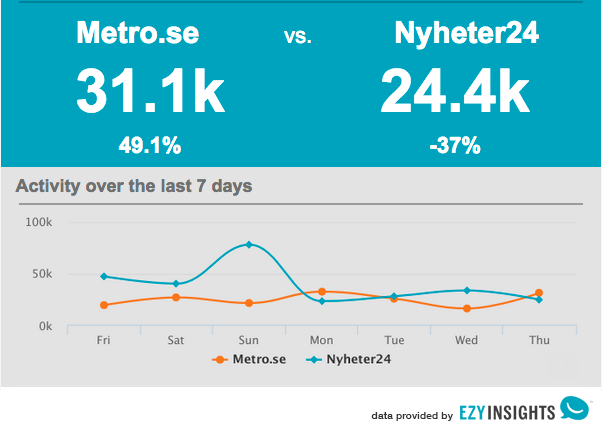
So if we take the same two publishers on the same day, add in the off-post engagement, and strip away engagement from photos and videos, we see a totally different picture:
All of a sudden it is Metro who is on top. Although that is not always the case as you can see in the 7-day activity chart, the competition between the two publishers is a lot closer than indicated in the first image. This is not an unusual situation. When data is everywhere, incomplete or misleading data is also prolific – so it is important that everyone questions the data source behind what they are seeing.
This sort of information is important for many reasons, including to advertisers when choosing where to run their campaigns. Using figures that better correlate with traffic means that with enough data we can base solid estimates regarding total traffic to all publishers. Indeed this is something we have been hard at work doing at EzyInsights, which I hope to reveal very soon.
Finally, I shall leave you with a quote from the previously mentioned report into data-journalism that I should think many of you may find amusing. 😉


