Recently, Facebook expressed worries about becoming a link-sharing platform instead of a place to share our personal lives. Soon after, the US publishing platform SocialFlow reported a 42 % drop in Facebook reach per post for US media companies’ Facebook pages. In the first post from EzyInsights’ data analyst Varpu Rantala, we take a dive into months of historical engagement data to see what the real effects of reported algorithm changes have been across four Nordic countries.
The first thing to note is that we are not looking at reach, which is not public data, but rather engagement. Looking over a large set of data, we know engagement correlates highly with reach, but the actual reach figures are private to each publisher.
Another thing worth pointing out is that Socialflow’s article looked at a large number of FB pages, which will include many different types of page and publisher. We have narrowed this down very specifically to news publishers. We looked at data from the top 20 general news publishers in Sweden, Finland, Norway and Denmark alike, from May 2015 to May 2016. These four countries are especially good to look at for two reasons – one is that due to language barriers they get engagement mainly from within their own country, and secondly they all receive broadly similar levels of engagement relative to their population.
In Norway, on top are such companies as Norway TV 2 Nyhetene, Dagbladet.no, Aftenposten, VG and NRK Nyheter. In Sweden, the top 20 includes companies like Metro Sverige, Dagens Nyheter, Al Kompis, Göteborgs-Posten and ETC-tidningarna. In Finland, there are Yle Uutiset, MTV Uutiset, HS.fi, Aamulehti and Uusi Suomi. Denmark has TV2 Nyhederne, BT, Dagens.dk, Ekstra Bladet and DR Nyheder on top.
Drop or dilution?
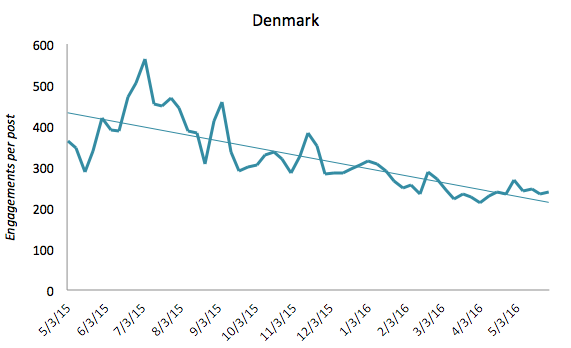
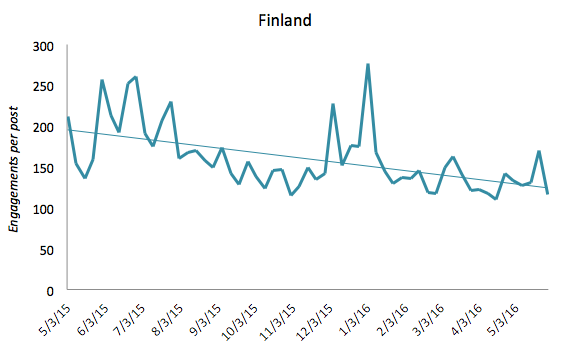
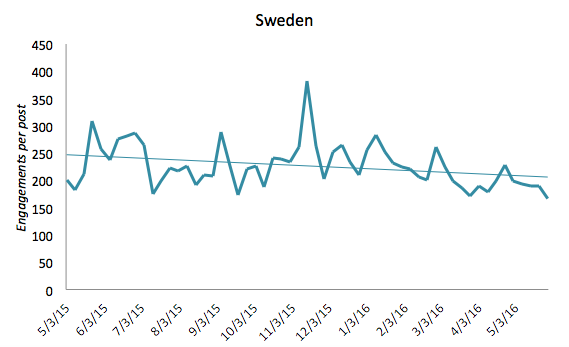
The unit of measurement is engagements per post (the sum of likes, shares and comments for the publisher’s Facebook page, divided by the amount of posts per month). As you can see, our data does show a declining trend in Facebook engagements per post. However, looking at the historical picture across a whole year in the graphs below, we don’t see a specific drop in any of them in early 2016, when the algorithm change was reported. If reach did drop here dramatically, one would expect engagement to also fall, as less people would be exposed to these posts. It may also be that any reach drop has been localised to people who do not engage with posts from these news publishers, or even a tweak by Facebook to how reach numbers are reported.
What does this mean?
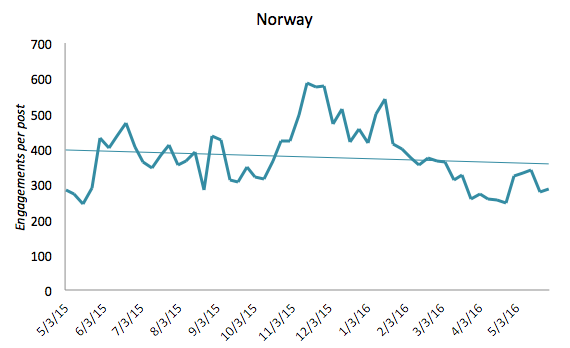
Looking on a per country basis, it’s clear that different countries and publishers have had different trends. Finnish and Swedish publishers have remained rather steady, while Denmark’s publishers have declined the most in a year’s time – from March 2015 to May 2016, rather than from January 2016.
There are likely two main contributing factors to explain these trends, beyond any specific algorithm change. As a rule, the number of Facebook posts per publisher has increased over the period examined, naturally diluting the engagements per post figure. The other would be that these publishers are facing increasing competition within Facebook for attention.
Norway’s drop after a peak
Norwegian news media has experienced a distinctive peak at the turn of the year, as well as the decline after it. When we look at a shorter timespan – the spring 2016 from January to May – Norway shows the most dramatic drop, whereas Denmark appears relatively steady in comparison.
Denmark’s trend line is parallel to the trend lines for Swedish and Finnish publishers over this time period.
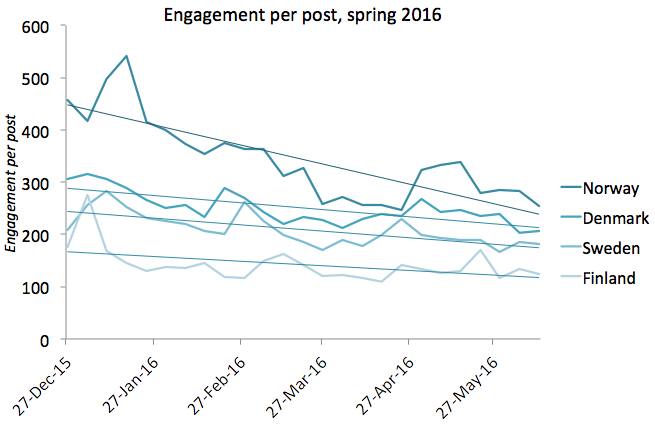
When we look at the top 20 news publishers in Norway, the drop from early January has been 44 %. For other countries, it has been smaller. Denmark it has been 33 %, Sweden 13 % and Finland 29 %. Without the context of Norway’s previous peak, this decline looks fairly dramatic, but over a slightly longer period you can see it as a rebalancing to a level in line with the rest of the Nordic area.
Including Norway, the drop from early January to May 2016 for these countries together has been 33 %. The figures start growing again towards May.
Norway’s video experiments
What caused Norway’s rise at the turn of 2016 and the decline that followed? We took a closer look into the data to see if different content types (photos, links, videos) could help to explain.
The bump contains one week that is distinctive for the amount of engagements for video posts. See the week that starts 11th of January below.
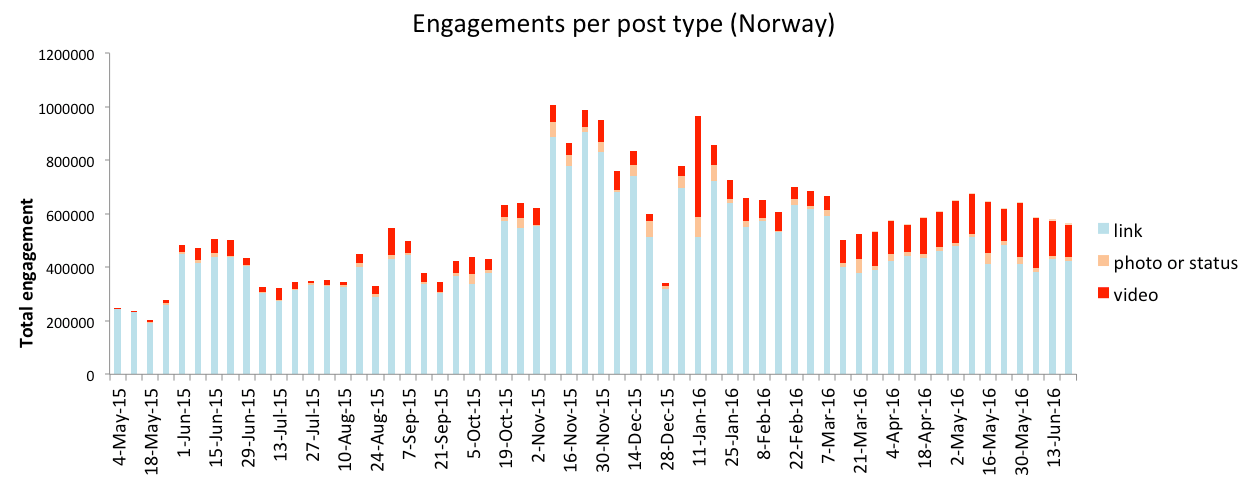
The distinctive amount of video engagements, located at the time where Norwegian publishers go up much more than usual, suggests a significant tweak for visibility given to video posts at that time by Facebook. After that, the proportion of video engagements diminishes for a while. For Facebook to make a more significant algorithm change localised to one small country makes sense from a testing perspective. Around March, video engagement has stabilised, yet it has also clearly increased as a proportion of total engagement. This is in line with what we have seen across all countries in EzyInsights. Facebook reward video content, thus publishers post more video content.
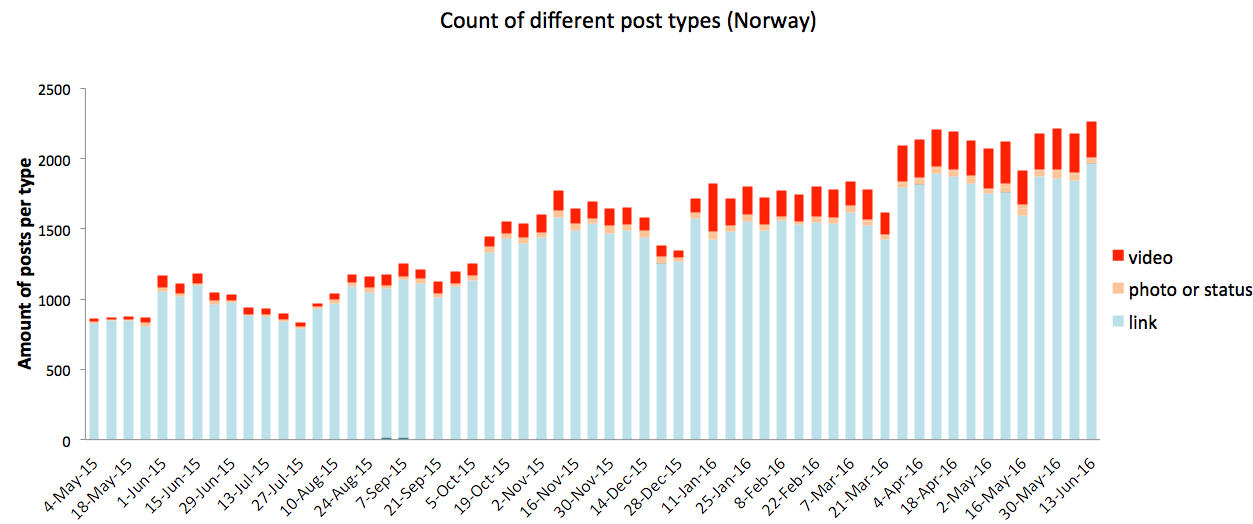
On the week starting on January 11th, there was a visible increase in the amount of video posts, too – 337 altogether – in comparison to the 50-120 posted videos of the preceding months. After that week, the amount of video posts shrinks a little. It stabilises to around 250 video posts per week towards summer 2016.
What type of content works best?
The previous graphs were based on the total engagement and the total count of posts. When we look at the engagements per post for different types of posts – links, photos or status updates, videos and live videos – we notice that photos and statuses do very well, and so does Facebook live video.
However for news publishers, photos, status updates and live videos are posted seldom in comparison to sharing article links.
For example, in May 2016, only 4-10 live videos were posted per week, but they gathered a relatively huge amount of engagement.
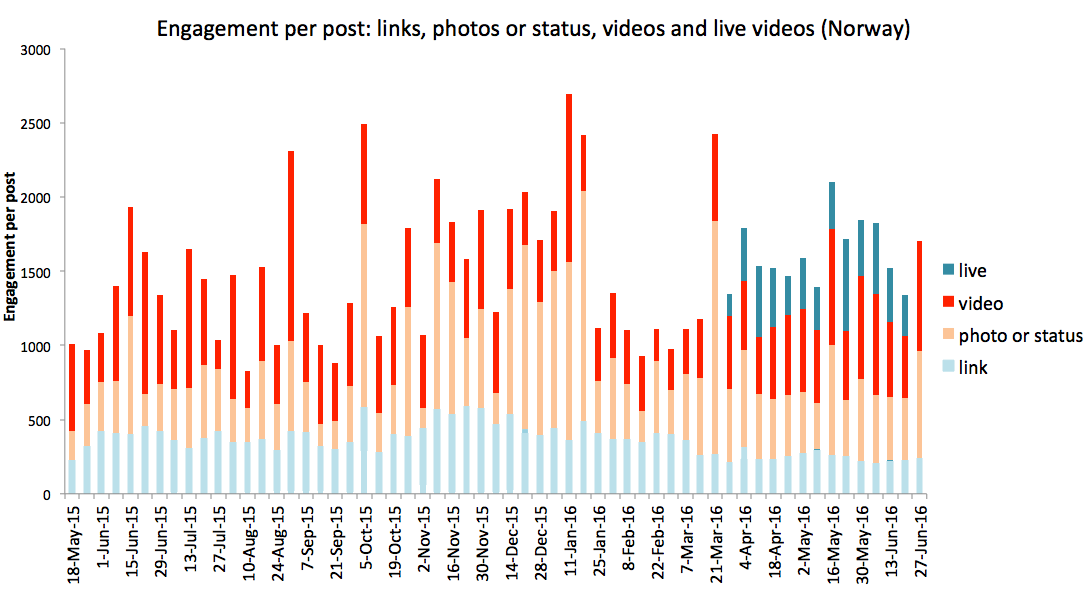
This is a particularly clear example of Facebook’s algorithm favouring specific content that they are trying to push. In this recent case it is Facebook Live Video.
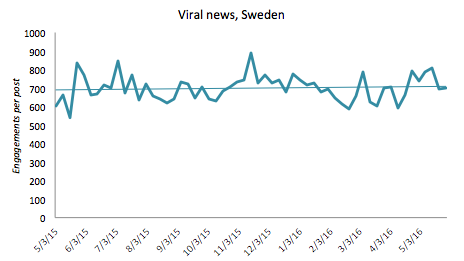
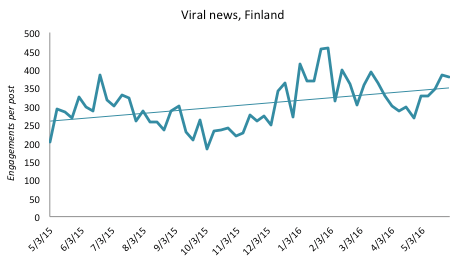
Viral news remains steady.
Facebook’s possible experimentation with Facebook video visibility may have caused the bumps in the Norwegian data, yet this alone doesn’t reflect any wider Facebook algorithm change aiming to punish media publishers.
The differences in the figures reported by SocialFlow on US data and our own Nordic data is likely because SocialFlow studied all types of publisher categories at once. Not only do we see a lot of variation between countries, when we look at Viral News vs General News, we see even more variation.
Despite the drop in engagement per post for news publishers, the top viral news sites in Sweden and Finland have stayed steady or even risen. In the Finnish data, there is a notable rise in May for the top 20 viral and entertainment publishers like Arvostettu, Viihdelehti Stara and Funland on top. All publishers that are more likely to use photos and native FB video to gather engagement, compared to news publishers posting mostly links.
In Sweden, the viral news sites like Newsner, Nyheter24 and Uppskattat are very steady.
What should you do?
Based on our data, it is an open question whether one can attribute the decreasing trends in Facebook publishing to a specific Facebook algorithm change that took place in early 2016, or whether there are some other reasons, such as experimentation with video visibility and even the advent of live videos.
In case the decline has to do with the algorithm change, for news publishers it may be prudent to experiment with different publishing strategies and posting more of other types of content beyond links. It is worth remembering that live videos, status updates and photos gain relatively high engagement.
It may also be worth noticing that Finnish and Swedish viral publishers have not declined. These pages tend to publish much more frequently than news publishers – around 40 posts per day in comparison to 10-20 posts. Viral news pages also tend to be quicker to start pushing out the content that Facebook favours. This doesn’t mean that news publishers should suddenly post more times in a day – one has to remember that the optimal posting frequency is also relative to the type of publisher, and the general news companies have done well by publishing less frequently than the viral sites. The crucial thing for all publishers is to keep a close eye on all data available and be best prepared to dynamically adjust posting strategies.
While we will continue to examine data ourselves, if you’d like us to investigate similar data in another country, please do let us know.