A lot has been written about regarding Filter Bubbles in the past 18 months, yet the real effects upon individual users are not widely understood.
Filter bubbles are understood to be a result of algorithms on social platforms. On Facebook, they decide in large part what content an individual is exposed to in their newsfeed. Over time, being locked in to a filter bubble may help to reinforce and promote a specific worldview. The content presented to users is one part of the issue, the other is the exclusion of pages, leading to increased polarisation as different groups of people end up experiencing different versions of reality within their personalised newsfeeds.
As consumers, filter bubbles have certain benefits. If a user is interested in a set of subjects and trusts certain news outlets, it may suit them to see content that accommodates these preferences. One concern with having an external technology deciding what content to serve to users is the lack of transparency. Users may well not think about why they are being served the content they see. They may not even feel as if they are in a bubble at all, as they remain unaware of content they are not shown.
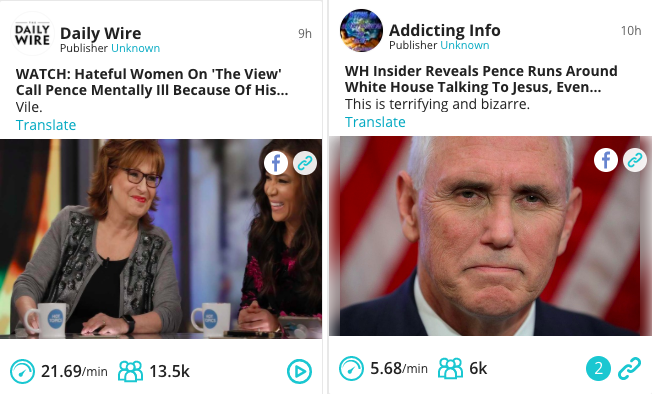
However, many publishers understand that the Facebook algorithm largely optimises for engagement. Some publishers optimise for and chase this engagement in order to generate high organic reach and ensure their content is fed repeatedly to users. Users who engage are more likely to see future content from the same publisher, especially content that engages many people. The type of post that has proven to be the most engaging involves some kind of ‘will-to-action’ – often stoking fears or provoking through outrage.
This is less harmful when it comes to sports and entertainment – a user may specifically want to see content from certain teams, players or celebrities. But this can be particularly detrimental when it comes to wider topics such as politics, economics and global issues like climate change, vaccination or religion.
Breaking the bubble
It is often a source of great surprise to experience another person’s newsfeed, which looks superficially similar but may contain very different content and narratives. There have been projects that attempt to show opposing narratives you may see on Facebook (http://graphics.wsj.com/blue-feed-red-feed/), yet these tend to focus on the extreme ends of the political spectrum.
Examining these hand curated groups of opposing, heavily partisan publishers gives a view that may seem exaggerated to readers who would consider themselves fairly moderate. Indeed, the danger is that many people consider filter bubbles to be something that other people are in, but not themselves.
This is a widely accepted idea, but with little in the way of studies to conclusively show it to be true.
We have long had an idea that someone who interacts with a specific page would also see and interact with content from other similar pages. The theory is that this leads to a cycle of engaging with specific publishers and thus being served content from similar publishers more frequently, until a user is trapped in a filter bubble. Finnish public broadcaster YLE explored this phenomenon back in 2016: https://yle.fi/uutiset/3-8912662.
This is a widely accepted idea, but with little in the way of studies to conclusively show it to be true. Facebook itself insists that the algorithm has so many factors affecting what it serves you, that it is self righting. That a diverse set of friends will help balance out what you see on the platform.
Until now we have been unable to shine a light inside these potential filter bubbles. However, armed with a lot of data, we have been able to start creating an idea of how pages are related based on user behaviour. Analysing which pages share audiences, we can start to reverse engineer the filter bubble – to see what a bubble might look like based on one or more of the pages any given user interacts with.
How much data and how to analyse it.
To start this project we severely limited the amount of pages available in phase 1. We analysed:
The top 48,000 Facebook pages (based on FB’s “talking about this” metric)
4.8 million posts
200 million unique users
3.3 billion data-points
This seems like a large amount of data, but it is relatively small compared to the Facebook ecosystem. As this is sampled data from such a large dataset, (i.e. all Facebook users) connections between publishers tend to be very sparse, and so the model we chose needed to deal with this.
Several data mining algorithms were also looked at but none were scalable enough to fit our requirements. We finally settled on a rather unique collaborative filtering approach that we developed in-house. The model embeds each publisher in vector space, with each set of vectors accurately describing the audiences of each publisher within the Facebook ecosystem.
This allows us to analyse the behaviour of hundreds of millions of users in microseconds.
Visualising the Matrix
To visualise this data we used a Google project named “Embedding Projector” found in Tensorboard, which has made the task of visualisation and exploring the data simple (and quite hypnotic).
The top 48,000 Facebook pages visualised.
The Results
The obvious bubbles to shine the light on first are in the political and news genres that have dominated Facebook over the last 18 months. We have an idea that people who read Breitbart, The Daily Caller or InfoWars, generally low quality, hyper partisan content and junk news, may be locked into a filter bubble in which they are only served content from similar publishers. At last, we are able to map out these ecosystems of shared audiences.
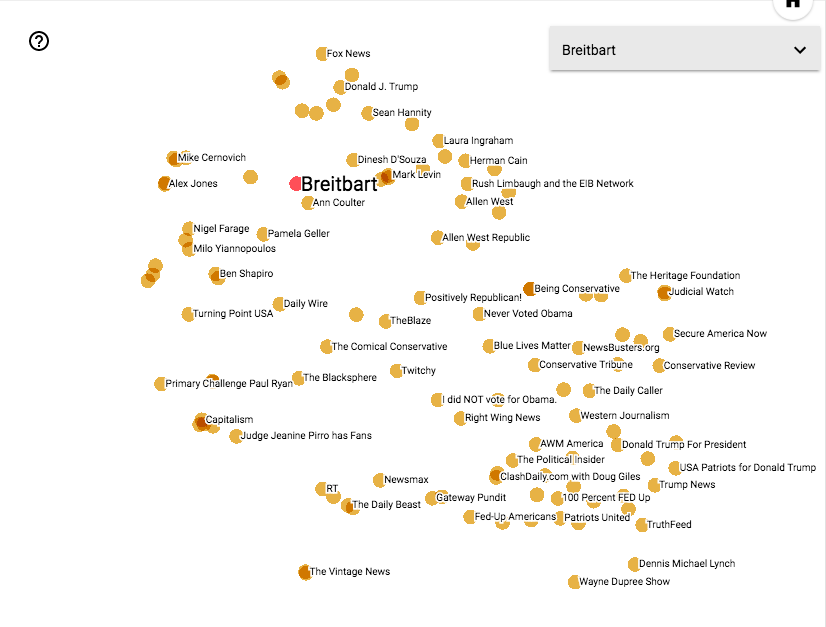
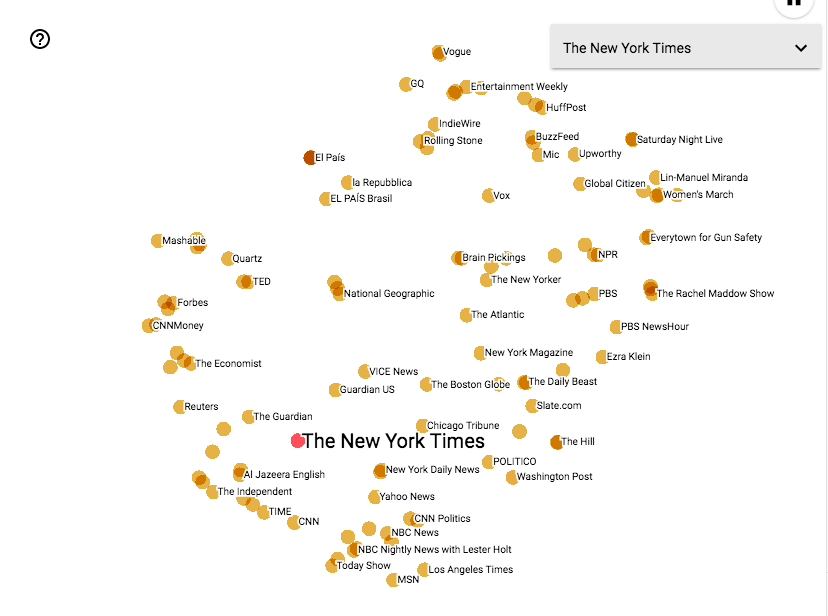
The Embedding Projector allows the connections between the publishers to be visualised in different ways, depending on the selected algorithm and input parameters. By tweaking these inputs, one is able to amplify or weaken connections for easier analysis.
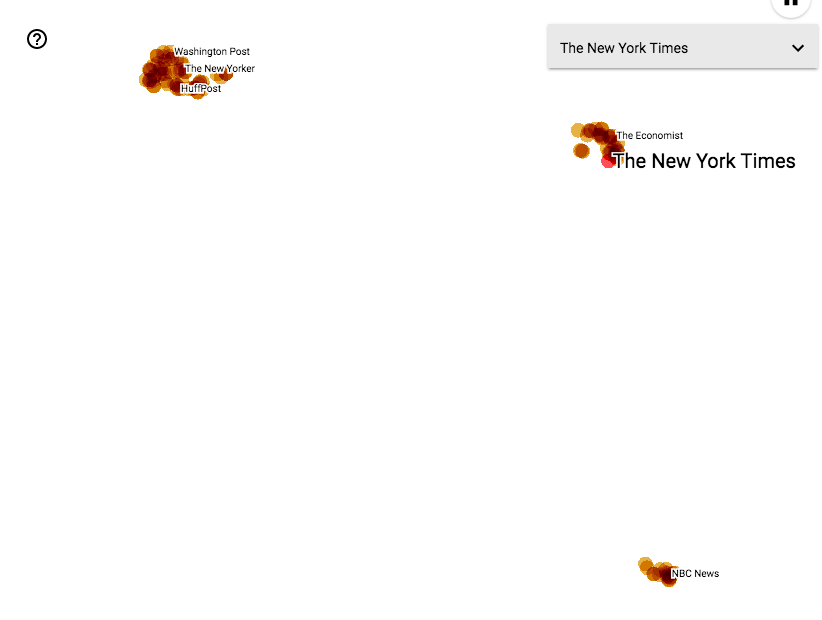
As you can see, by amplifying connections, the Pages have been sorted into 3 distinct groups, which while harder to parse in a single image, can be examined in more depth by zooming in, or isolating clusters for further analysis. We’ll examine this in more detail in future.
Another possible use for this technology is arranging pages not just around a single publisher, but between two poles. Taking two publishers at opposing ends of a political spectrum, the system is able to distribute a further set of publishers along that spectrum purely based on user behaviour and shared audience.
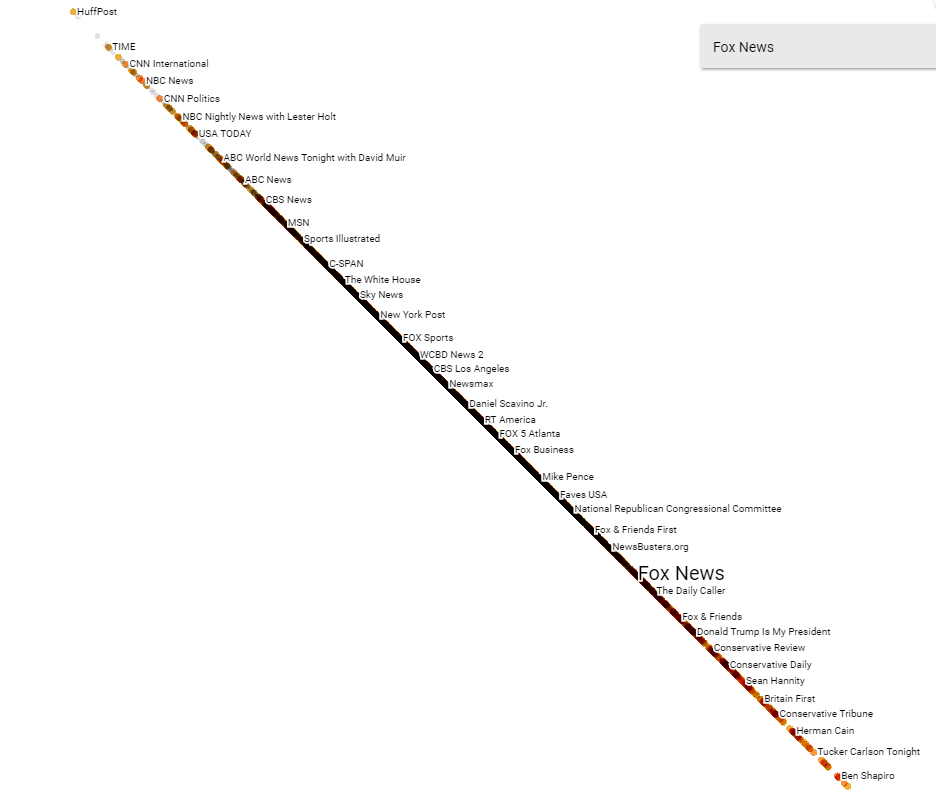
An obvious use of this is to generate a map of the political media landscape within any given country, but another could be involving brands. If we were to enter the pages of two mobile telephone companies, we could then feed in any set of pages to see which pages are closer to each telephone company. It might also reveal where a shared audience exists – which pages are interacted with by audiences of both companies.
Finally, grouping the pages around the strength of connection they have with each other can help publishers and advertisers target specific audiences based on their behaviour rather than arbitrary attributes. Typical demographics don’t distinguish behavioural differences between otherwise identical looking audiences.
In Summary
The initial results of our experiment are encouraging. Artificial Intelligence offers a new perspective on identifying filter bubbles and audience behaviour.
In general, breaking filter bubbles is interesting, important and valuable
AI works well for analysing and modelling publishers, newsrooms and social media audiences. Initial findings based on this approach are encouraging
We’ll continue to explore this area using different data, algorithms and visualisations. In the meantime, let us know what filter bubbles you’d like to burst.