Web Shares now deliver the majority of engagement for newsrooms and publishers in several European countries. If you don’t track Web Shares you could be missing over half of your engagement.

What is a Web Share?
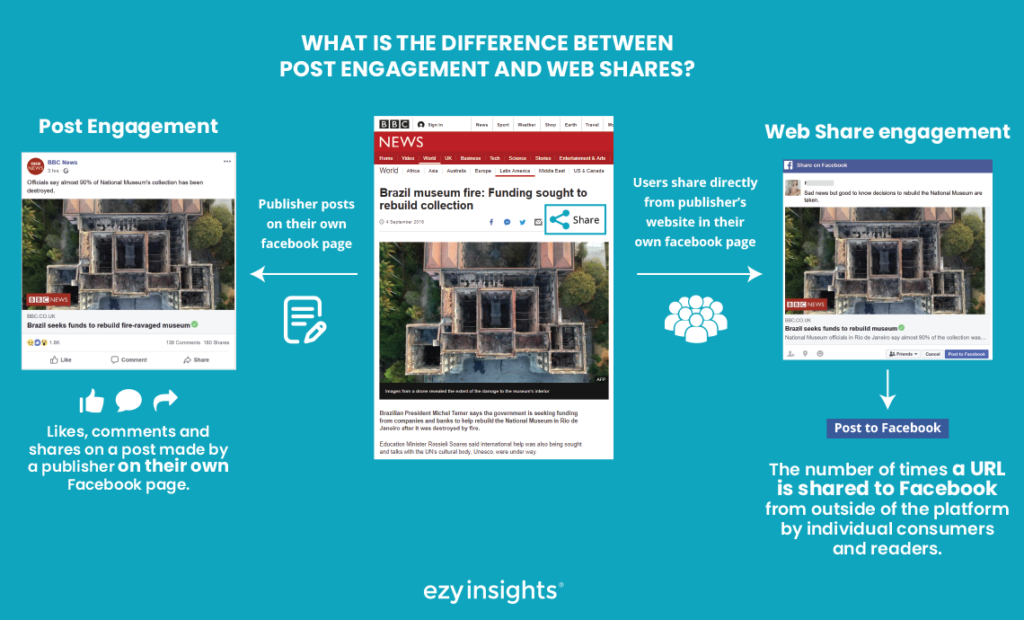
Total engagement on social media has two components, Post engagement and Web Shares.
- Post engagement occurs on the original post by the publisher. It shows how many times readers like, comment and share the original social media post.
- Web Share engagement is based on individual readers going to the publisher’s website and sharing the article to their personal social media accounts.
Web Shares in performance measurement and analytics
Tracking only posts on social media platforms you’ll miss roughly 50% of engagement and 80% of published content. Web Shares (individual readers sharing articles on their personal social media accounts) deliver a significant amount of your total social engagement.
Due to the latest Facebook algorithm changes (see our recent research reports at ezyinsights.com/papers) the importance of Web Shares has overtaken Post Engagement in the past year.
Web Shares in news gathering
Typically newsrooms post 15 to 25 articles on a single social media channel daily. That could be less than 10% of their daily articles. If you’re discovering trending news through Facebook posts alone you’ll miss most new content because stories published only on a website will be generating significant engagement through Web Shares.
Tracking Web Shares together with Post engagement gives you an accurate view of what is really popular.
Web Shares in selected countries
Let’s take a look at Web Shares in selected countries across Europe and see how much of the total engagement they account for.
We analysed the top three publishers (based on their social media engagement) in Denmark, France, The Netherlands and Sweden. We measured total Facebook engagement over three separate points in time; December 2016, August 2017 and August 2018. Each data point contains one week’s worth of engagement data.
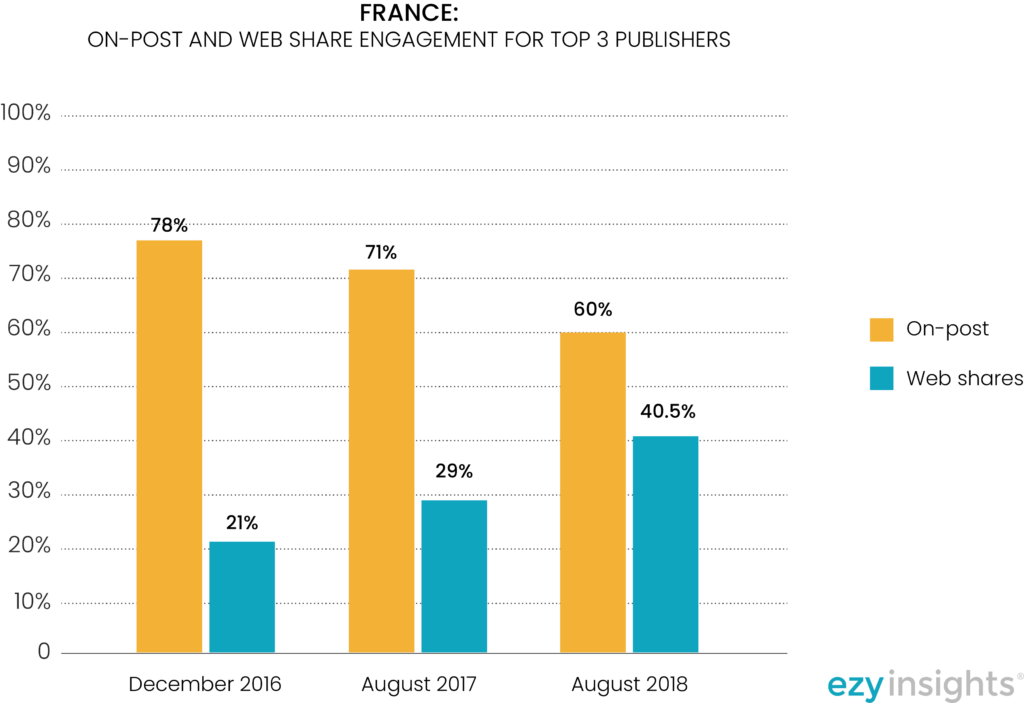
France
In France, Post engagement retains a slim majority. Looking at the current trend, Web Shares will make up the majority of engagement within 6 months.
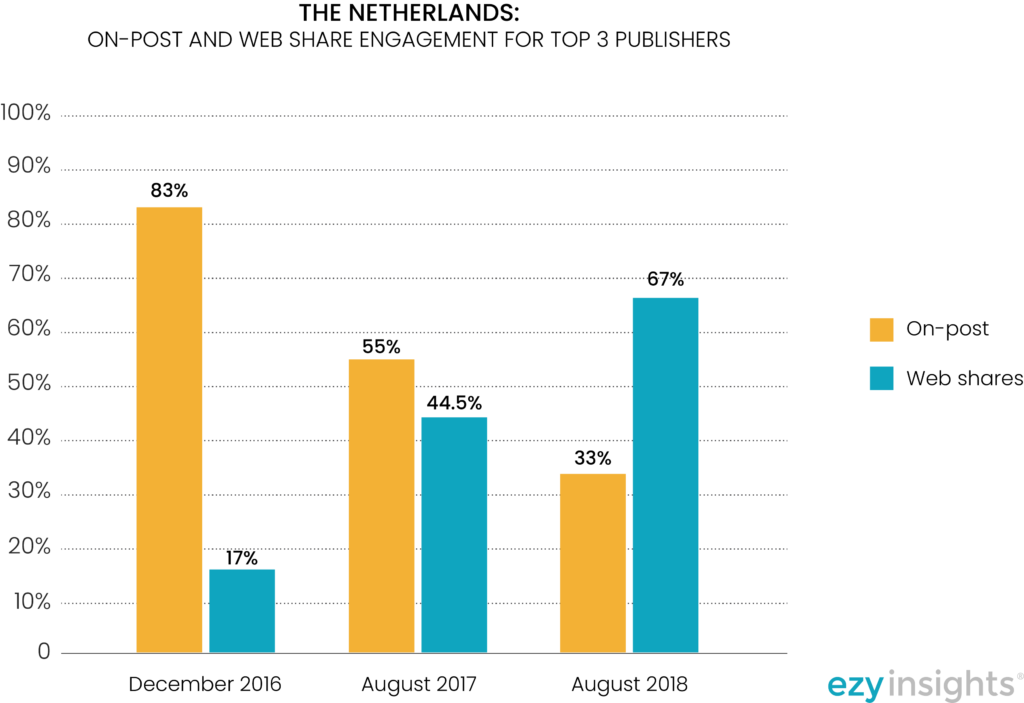
The Netherlands
The growing importance of Web Shares is more dramatic in The Netherlands. Web Shares by quantity had already passed On-Post engagement in September 2017.
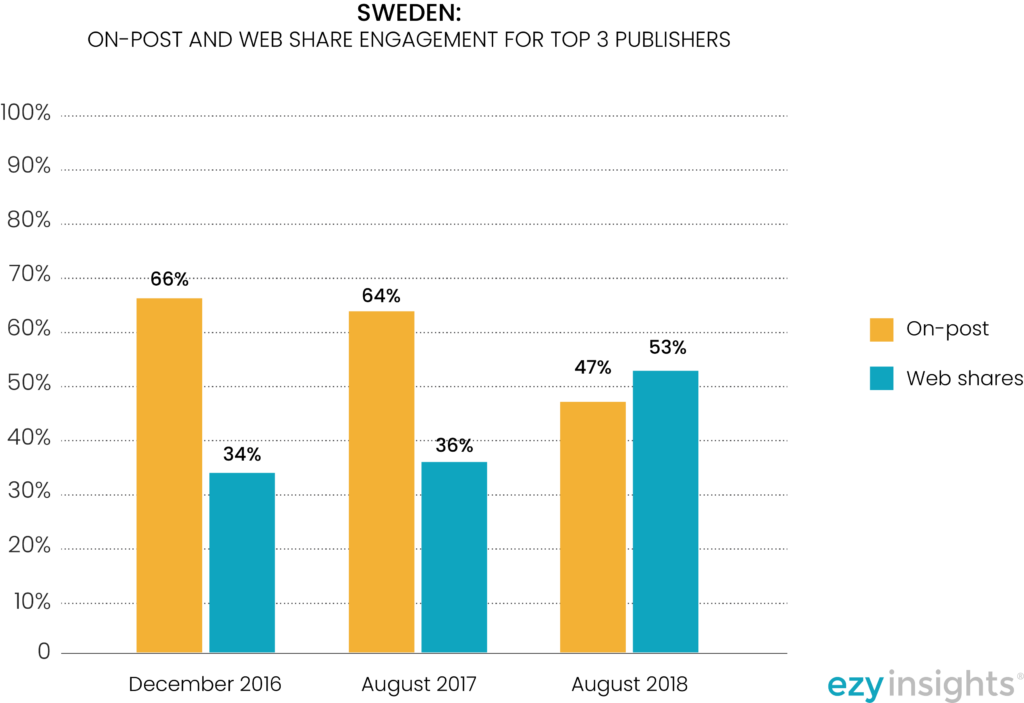
Sweden
In Sweden, one of the most developed online media landscapes, the trend is similar to other countries covered in our analysis. The importance of Web Shares has grown steadily, overtaking Post engagement in August 2018.
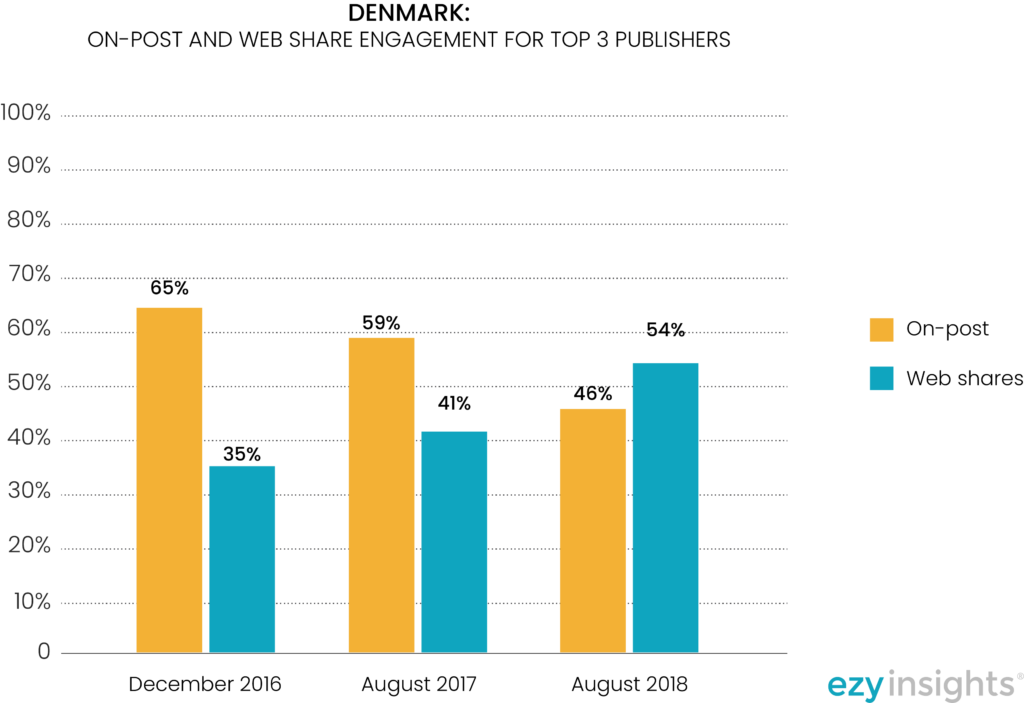
Denmark
In Denmark, web Shares now account for the majority of social media engagement.
Summary
For a complete view, it is essential that publishers, newsrooms and journalists track both Post and Web Share engagement.
Web Shares behave differently across the editorial workflow.
- Web Shares in performance measurement. Web Shares deliver, depending on the country, roughly 50% of the total engagement. One should track both Post and Web Share based engagement to get a complete picture.
- Web Shares in news gathering. Tracking social media platforms for trending and viral stories is important. If you don’t track Web Shares you’ll miss up to 90% of the content as publishers typically post only a fraction of their content on social media platforms. Web Shares enable you to find stories being shared by individual readers regardless of whether they’ve been posted on social media by the publisher.
What’s next?
Interested in tracking Web Shares in your newsroom? Request a demo!
Interested in specific publishers or countries? Ask us a question!
Background materials
Below we have included the raw data used in this article.
Data source for analysis: SoMe Index (someindex.com). The dates mentioned in the data tables and in the chart are publication dates of the data. Each data point contains data for one week (i.e. 7 days).
Country specific data sets:
Engagement data for Denmark
| Date | Publisher | Total engagement | On-post | Web Shares |
| Aug 21st 2018 | TV 2 Danmark | 701 372 | 376 319 | 325 050 |
| dr.dk | 336 028 | 112 560 | 223 459 | |
| Ekstra Bladet | 220 682 | 86 986 | 133 696 | |
| Sum | 1 258 082 | 575 865 | 682 205 | |
| Aug 15th 2017 | TV 2 Danmark | 908 203 | 554 017 | 353 926 |
| BT | 381 690 | 192 805 | 188 885 | |
| dr.dk | 284 793 | 175 936 | 108 663 | |
| Sum | 1 574 686 | 922 758 | 651 474 | |
| Dec 6th 2016 | TV 2 Danmark | 1 172 866 | 760 882 | 411 745 |
| dr.dk | 478 646 | 335 992 | 142 343 | |
| Ekstra Bladet | 363 783 | 205 210 | 158 494 | |
| Sum | 2 015 295 | 1 302 084 | 712 582 |
Engagement data for France
| Publisher | Total engagement | On-post | Web Shares | |
| Dec 6th 2016 | 20 Minutes | 2 354 084 | 1 255 899 | 1 097 146 |
| minutebuzz | 1 701 819 | 1 701 819 | N/A | |
| L’EQUIPE | 1 519 487 | 1 402 732 | 116 737 | |
| BFMTV | 1 366 162 | 1 103 924 | 261 879 | |
| Sum | 6 941 552 | 5 464 374 | 1 475 762 | |
| Aug 15th 2017 | Sais-tu que ? | 2 277 483 | 2 277 483 | N/A |
| BFMTV | 2 222 068 | 1 191 070 | 1 026 409 | |
| 20 Minutes | 2 139 341 | 1 110 471 | 1 027 610 | |
| Sum | 8 005 054 | 5 682 948 | 2 315 898 | |
| Aug 21st 2018 | BFMTV | 1 668 325 | 884 453 | 783 863 |
| Le Parisien | 1 487 413 | 657 755 | 829 640 | |
| Le Meilleur du Football | 1 070 075 | 1 070 075 | N/A | |
| France Télévisions | 1 054 106 | 532 080 | 522 019 | |
| Sum | 5 279 919 | 3 144 363 | 2 135 522 |
Engagement data for The Netherlands
| Publisher | Total engagement | On-post | Web Shares | |
| Dec 6th 2016 | dumpert.nl | 625 203 | 592 692 | 32 508 |
| AD.nl | 403 560 | 276 080 | 127 016 | |
| Metro Holland | 266 105 | 206 230 | 59 857 | |
| Sum | 1 294 868 | 1 075 002 | 219 381 | |
| Aug 15th 2017 | AD.nl | 541 900 | 275 148 | 265 516 |
| NOS | 504 755 | 277 112 | 224 477 | |
| voetbalzone | 500 424 | 301 903 | 198 521 | |
| Sum | 1 547 079 | 854 163 | 688 514 | |
| Aug 21st 2018 | AD.nl | 503 360 | 169 186 | 334 174 |
| De Telegraaf | 351 847 | 111 568 | 240 276 | |
| NU.nl | 319 245 | 103 602 | 215 630 | |
| Sum | 1 174 452 | 384 356 | 790 080 |
Engagement data for Sweden
| Publisher | Total engagement | On-post | Web Shares | |
| Dec 6th 2016 | Newsner | 1 353 329 | 1 059 360 | 293 968 |
| Expressen | 1 008 315 | 543 894 | 464 158 | |
| Aftonbladet | 999 614 | 613 428 | 386 142 | |
| Sum | 3 361 258 | 2 216 682 | 1 144 268 | |
| Aug 15th 2017 | Newsner | 1 530 403 | 1 071 147 | 459 244 |
| Aftonbladet | 1 202 434 | 764 667 | 437 503 | |
| Expressen | 1 057 149 | 600 582 | 456 279 | |
| Sum | 3 789 986 | 2 436 396 | 1 353 026 | |
| Aug 21st 2018 | Expressen | 1 279 131 | 408 246 | 870 864 |
| Newsner | 1 138 022 | 858 573 | 279 445 | |
| Aftonbladet | 919 338 | 314 466 | 604 872 | |
| Sum | 3 336 491 | 1 581 285 | 1 755 181 |